Overview
Let’s kickstart today’s article by looking at what crypto chart analysis tools entail. Following that, we’ll dive into a comparison between free and paid crypto charting tools. Additionally, we’ll highlight the best free charting tool for crypto and the leading advanced charting tool for cryptocurrencies. In doing so, you’ll quickly discover that our preferred tool for gauging crypto chart trends is the Money Line indicator from Moralis Money. Fortunately, we’ll guide you on how to leverage this powerful crypto chart analysis tool to your advantage.
Although we’re going to look at the Money Line indicator as well as other crypto charting tools below in this article, here’s a sneak peek of how the Money Line indicator works:
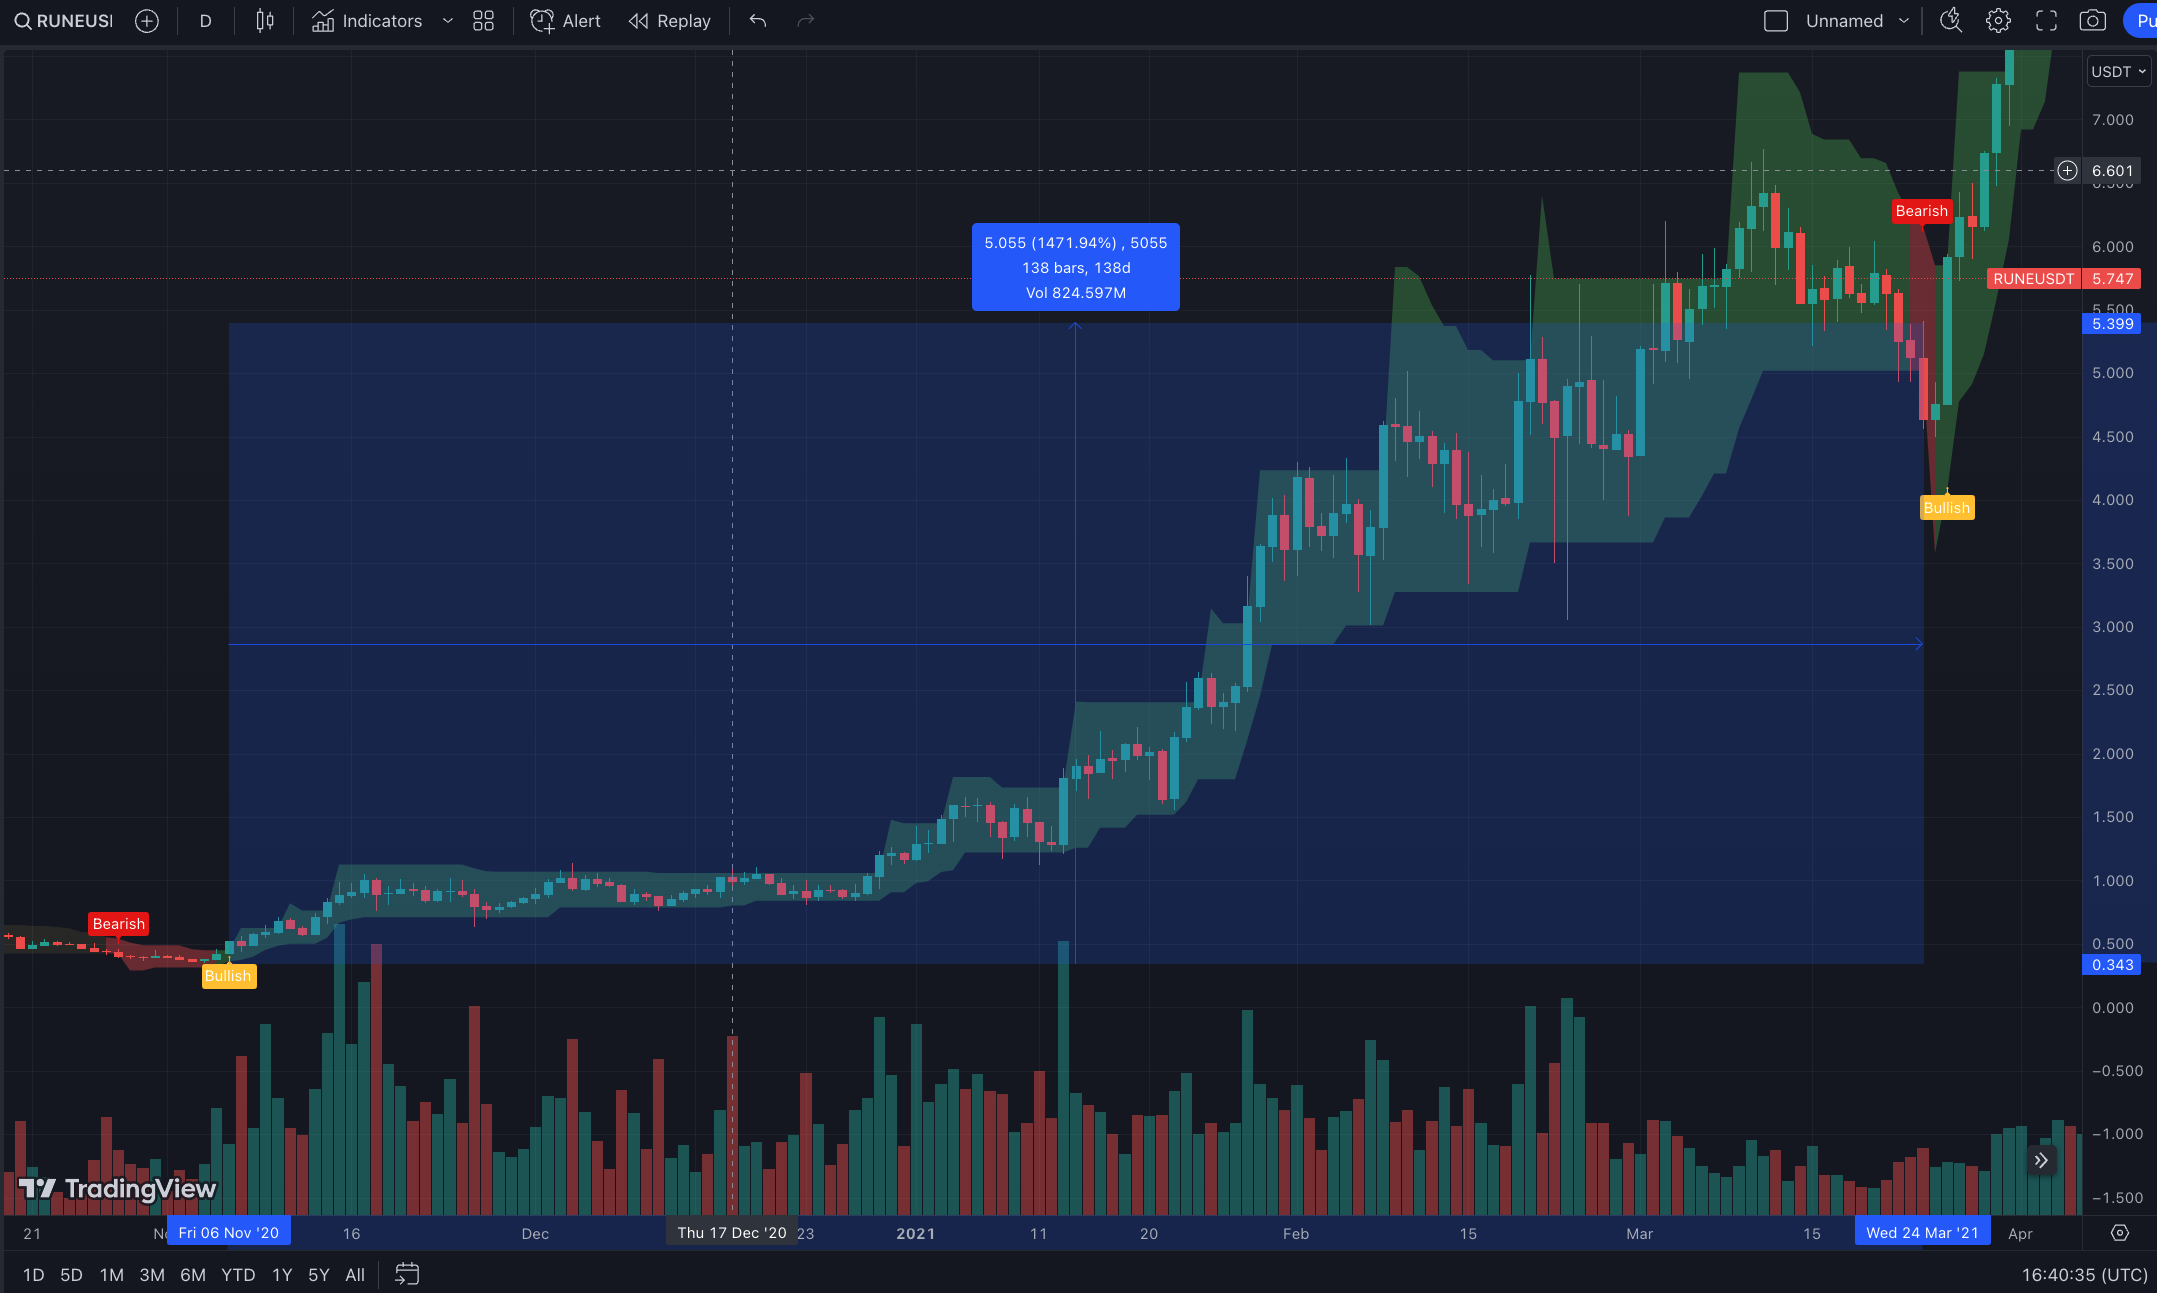
In the above image, you can see how the Money Line indicator printed “Bullish” on November 6th, 2020, for the RUNE crypto asset. If you had bought $1,000 worth of RUNE when it printed bullish and simply HODLed until it printed “Bearish” on March 24th, 2021, and then sold, you would have made a massive $13,710 gain!
And that’s how simple this crypto charting tool is; it simply gives you “Bullish” and “Bearish” signals!
Now, without further ado, let’s dive into crypto charting tools!
What are Crypto Charting Tools?
Crypto charting tools typically refer to pieces of software or platforms that mainly revolve around crypto charts. A great example of that is TradingView. These platforms allow you to view a wide range of crypto markets and explore their price charts and market cap info in detail. Furthermore, these crypto chart analysis tools can come in the form of online websites or downloadable pieces of software.
Additionally, crypto charting tools also refer to specific TA tools and indicators. These tend to vary from platform to platform. However, there are many common TA tools and indicators that are available across all popular crypto charting platforms.
To make proper sense of trends and price movements, you need solid tools to get the job done. For this, we use crypto charting tools, which can help you navigate the story painted by the crypto market. Moreover, these tools provide you with insights, patterns, and essential data to make informed trading decisions.
At its core, every free crypto charting tool and advanced charting tool for crypto leverage technical analysis (TA). TA is a method rooted in studying past market data to predict potential price movements. Unlike fundamental analysis (FA), which delves into an asset’s intrinsic value, TA focuses on analyzing historical price action.
Fundamentals of Crypto Charts
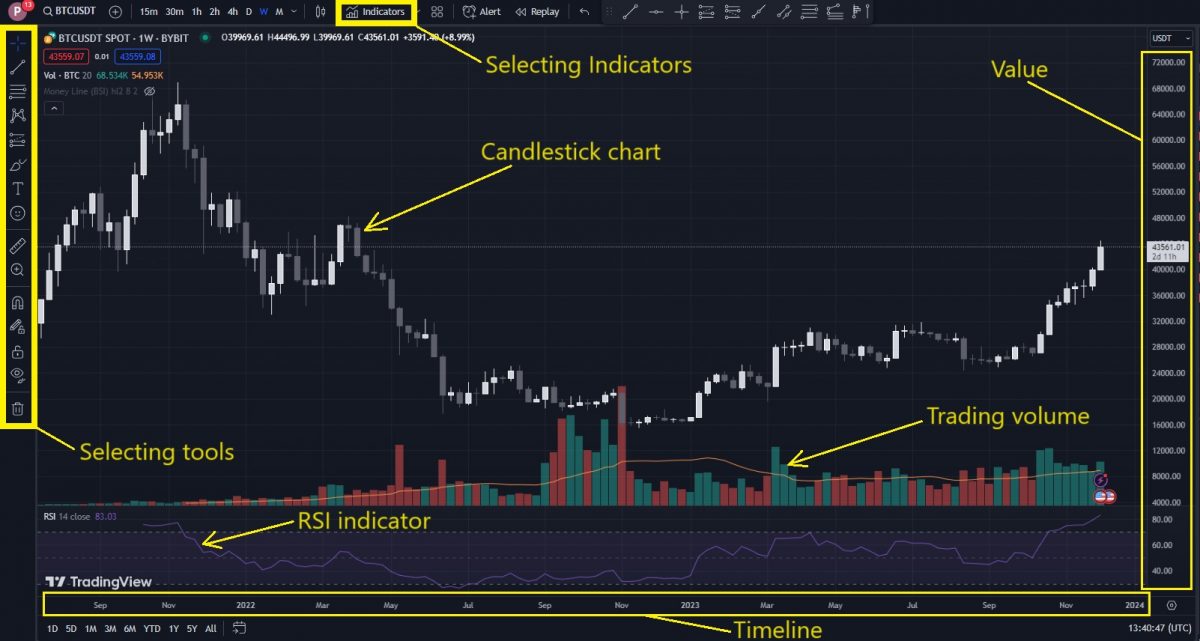
A typical crypto chart includes vital components such as the trading pair, current price, indicators, and various time increments. These charts, often presented as line or candlestick graphs, showcase essential data points like high and low prices, trading volume, and trends.
To help traders/investors make sense of the data offered by the charts, they use crypto chart analysis tools and indicators. For instance, the simplest crypto coin charting tool is a horizontal line, which helps spot levels of support and resistance. In addition, great examples of popular indicators include moving average (MA) and exponential moving average (EMA) lines.
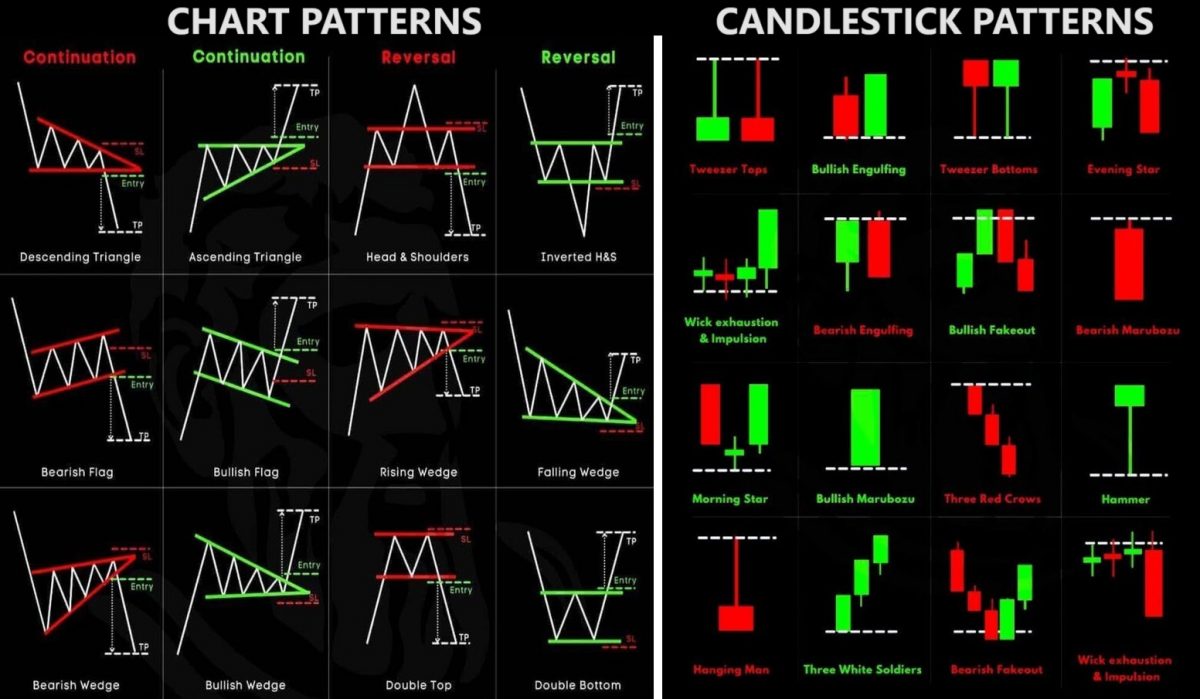
Traders utilize chart and candlestick patterns for more nuanced insights. For instance, candlesticks, with elements like bodies and wicks, can reveal the dynamics between opening and closing prices. Both candlestick and chart patterns come in the form of bullish and bearish patterns. The former ones signal potential upward movements, while bearish patterns suggest impending downturns.
Does Chart Analysis Work on Crypto?
Despite its rather long history (dating back to the late 1800s), many traders still don’t “believe” in TA. However, given the proven track record of TA, it is quite foolish to take such a stance. That said, it is important to know what TA is all about. TA is not about predicting the future or expecting certain patterns to play out on every occasion. Instead, it is about analyzing human psychology reflected via price charts. Understanding this can increase the chances of successfully reacting to market developments.
In other words, TA is all about probabilities and stacking them in one’s favor.
So, to answer the above question, TA works for crypto as well as it does for other asset classes. However, it is important to note that you can’t conduct proper TA on charts with limited historical data, nor can TA predict some insane crypto pump-and-dump scenarios.
All in all, proper TA gives crypto investors and traders a powerful edge. This is why having a good crypto chart analysis tool is extremely important!

Free vs. Paid Charting Tools for Crypto
We already mentioned TradingView as one of the most popular platforms for analyzing crypto chart trends. Well, it has a free plan that can get you far. However, if you are interested in some advanced features and options, such as viewing multiple charts at the same time, then you’ll want to upgrade to a paid plan.
Many other popular crypto charting tool platforms follow the same policy – offering basics for free and gating the advanced features.
Then, within these platforms, you have tools and indicators to make sense of crypto chart trends. And most of the charting tools are available for free. The same is true for many common indicators. So, if you have a solid understanding of TA, you can gain a sufficient edge from free tools and indicators.
However, there are also many advanced, powerful indicators that you need to pay for to access. Often, these indicators include some sort of combination of inputs and signals that make TA a whole lot simpler for beginners and TA enthusiasts. As such, it is up to you to determine your needs, preferences, and financial capabilities to decide what crypto chart analysis tools to opt for.
Although a free crypto charting tool can do the trick – especially if you use the best free charting tool for crypto – a paid crypto coin charting tool is usually the go-to option for many traders.
Note: Make sure to grow out of the “I want everything for free” mindset. After all, it takes time and skills to create high-quality tools, which is rarely free. However, always pay attention to what you are getting for your buck. Do not blindly think that a high price means high quality.
The Best Free Crypto Charting Tool
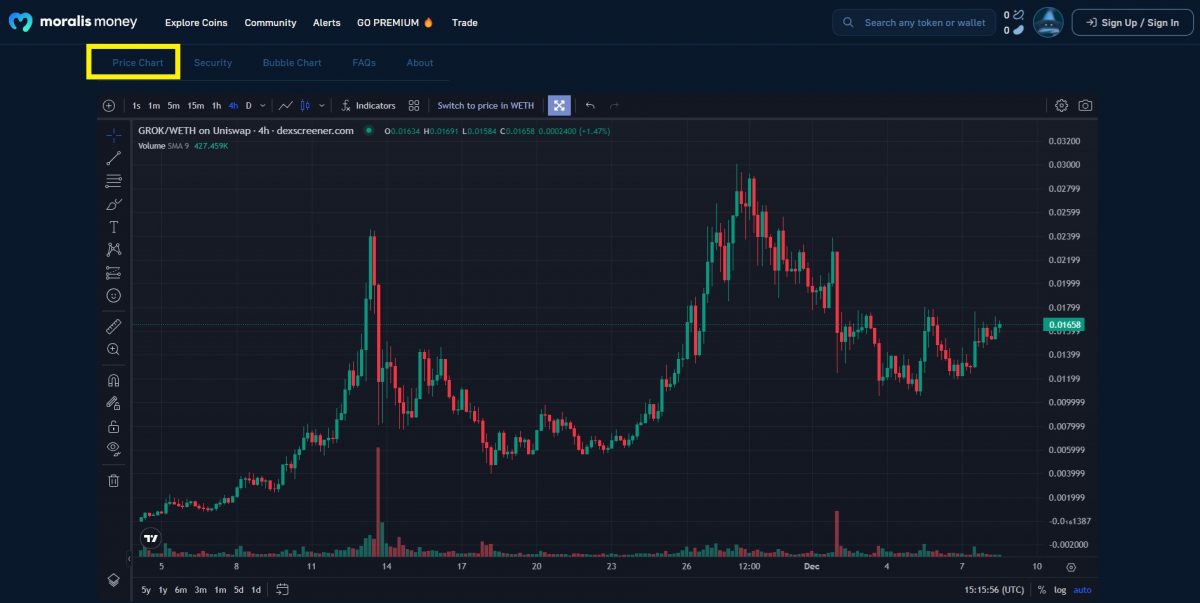
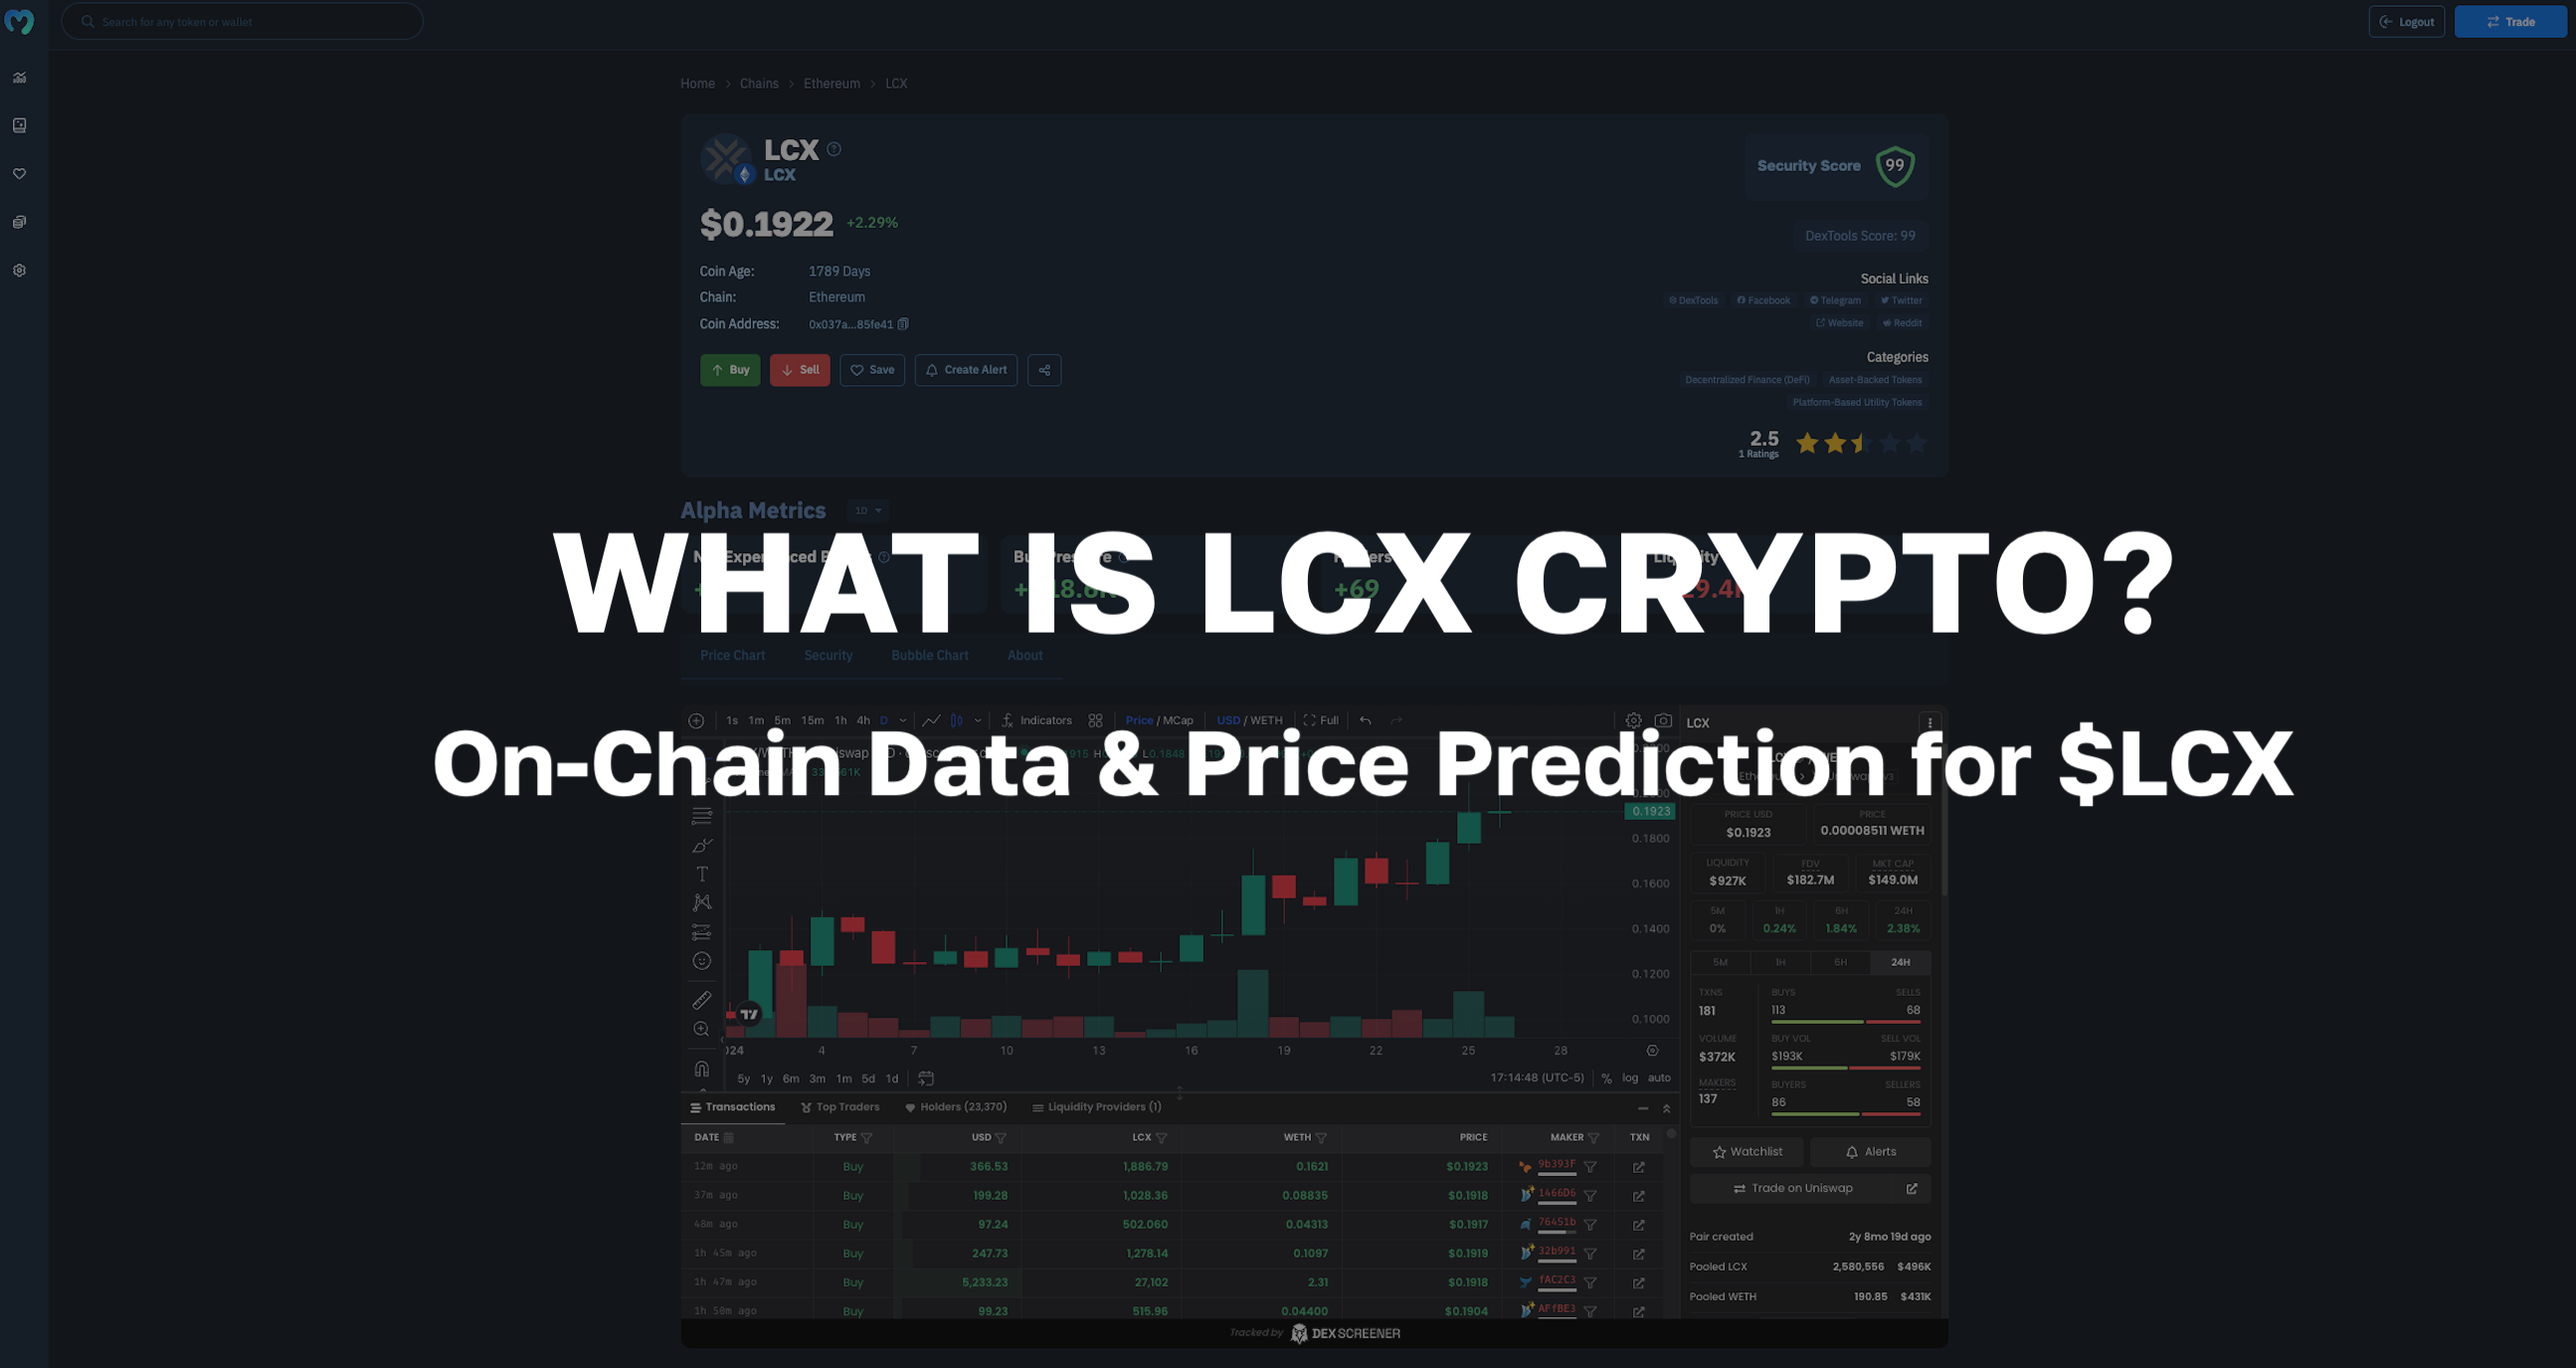
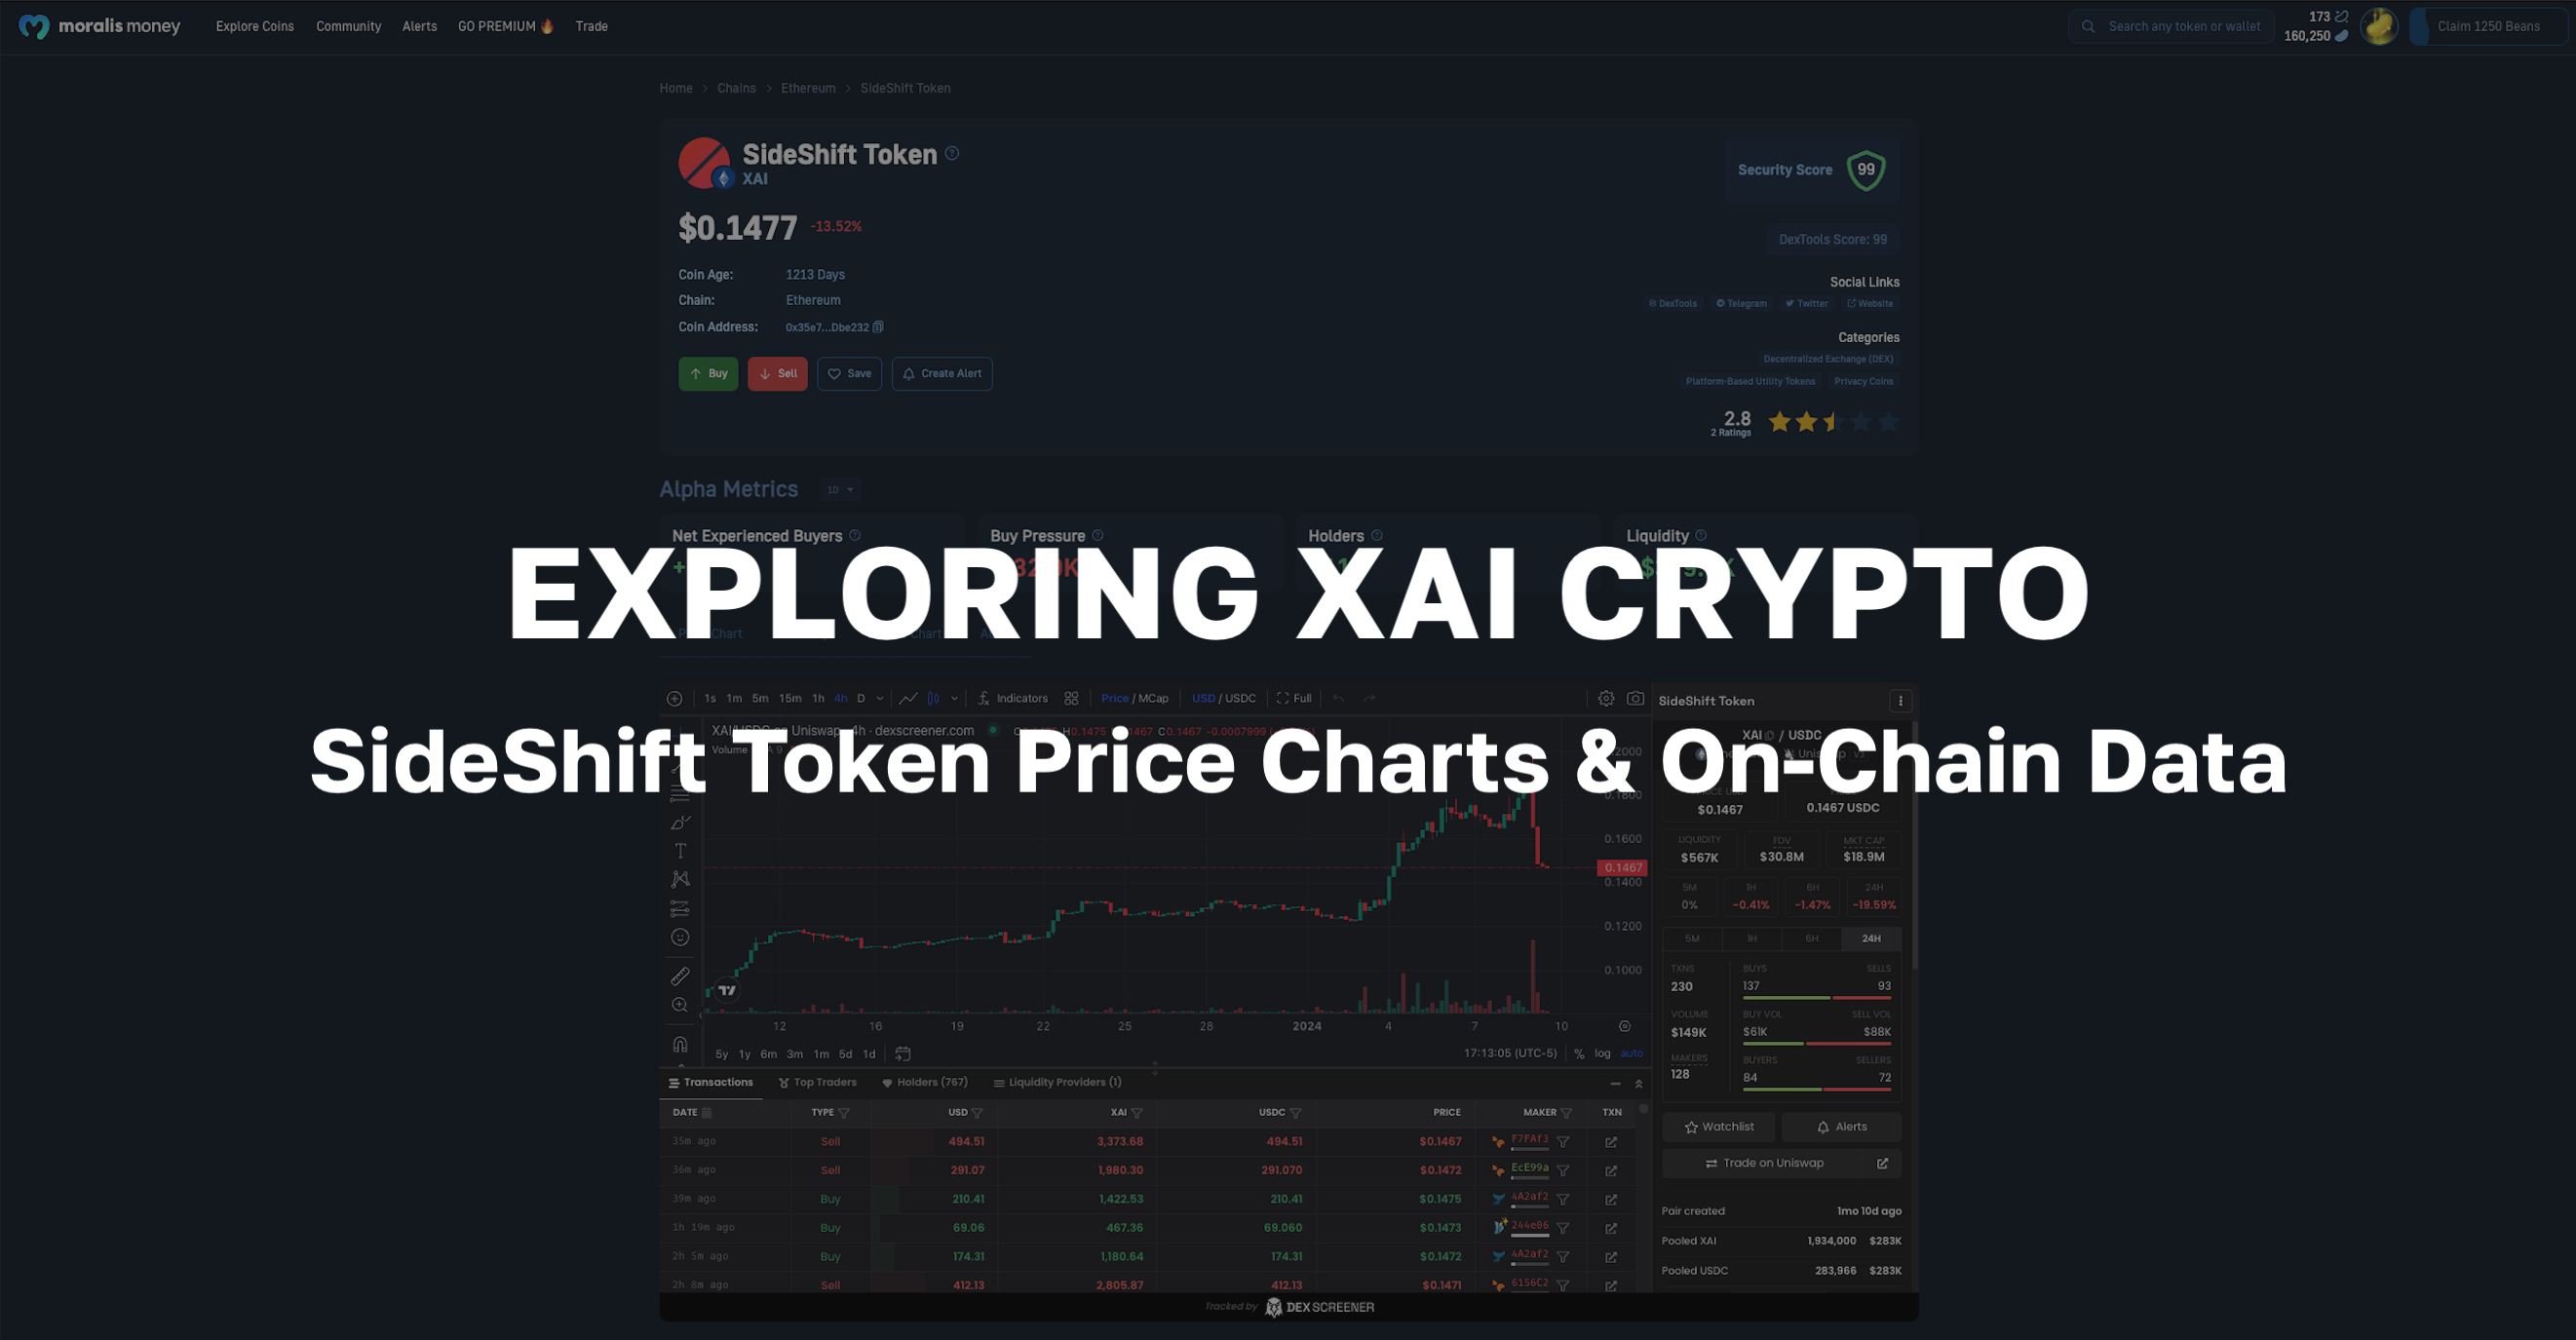
The above screenshot indicates the Price Chart section, which awaits you on every Moralis Money token page. And since Moralis Money supports all EVM-compatible tokens, you can use this powerful free crypto charting tool. Powered by TradingView, it allows you to apply all sorts of TA tools and indicators and conduct proper analysis.
Comparing its capabilities with other tools, such as charts offered by CoinMarketCap or CoinGecko, you’ll agree Moralis Money deserves the “best free charting tool for crypto” title.
How do you access the Moralis Money Price Chart sections? In general, you’ll get there by going to a token page and then scrolling down to the “Price Chart” section. In short, these are the two most popular paths to Moralis Money token pages:
- Use the search box – search by token address or name:
- Clicking on a specific token seen on the Moralis Money bubbles (homepage) or on any of the dynamic lists:

The #1 Advanced Charting Tool for Crypto
From the perspective of “individual platforms” for analyzing crypto chart trends, TradingView is the best crypto chart analysis tool. It covers a wide range of crypto markets, offers countless tools and indicators, and has a powerful free plan. Of course, it also offers several advanced plans for casual users as well as for professional traders/investors. Nonetheless, this advanced charting tool for crypto also supports other traditional markets.
On the other hand, from the perspective of individual indicators that make sense of crypto chart trends, Money Line is, without a doubt, the best choice. It combines the power of live market insights, simplicity, and real-time, on-chain data – unlike any other indicator.
Which is the Best Crypto Charting Tool?
So, out of TradingView and Money Line, which is the best crypto charting tool? The correct answer combines these two: it is the Money Line indicator applied via the TradingView platform. This combo unlocks invaluable insights into crypto chart trends!
By combining these two, you get to enjoy Money Line’s insights and, at the same time, have access to all the other tools and features that TradingView offers.
A free TradingView account is all you need to deploy this ultimate crypto chart analysis tool combo. As for Money Line access, you can also get this tool for free once you are a Moralis Money Starter or Pro user.
How to Use the Money Line Crypto Coin Charting Tool
To use the Money Line crypto coin charting tool, you need a free TradingView account and an active Moralis Money Starter or Pro plan. With these prerequisites, you can activate this powerful indicator on any chart. For detailed instructions on how to get access to Money Line, use this link.
With the above-covered prerequisites and initial setups under your belt, you’ll be able to apply Money Line to any chart, just as demonstrated in the above animation.
Interpreting Crypto Chart Trends with Money Line
Money Line is the ultimate trend indicator. It clearly spots and marks crypto chart trends using market and on-chain data. This makes it the go-to crypto chart analysis tool for understanding the market’s short-term movements.
To use Money Line effectively, you need to be mindful of just two things:
- Color Coding: Green indicates a bullish trend, and red indicates a bearish trend. Keeping an eye on these colors gives you a quick read on the market.
- Trend Reversals: A change in color can signal a potential trend reversal. Thus, make sure to watch for these shifts. You’ll spot them by noticing the accompanying “Bullish” or “Bearish” labels.
The “cloud” component (part in red or green color) is all about support and resistance. As such, you can use it to make smarter trading/investing decisions. For instance, when the price interacts with the cloud bands, it tells you about potential support (in uptrends) or resistance (in downtrends). Furthermore, bounces off the cloud bands can indicate trend continuations, while breaks through the bands might signal trend reversals.
Another great thing about Money Line is its versatility. After all, this advanced charting tool for crypto analysis adapts to various trading styles and timeframes. However, note that the most optimal timeframes for the indicator’s performance vary depending on the cryptocurrency you’re analyzing.
For instance, when determining Bitcoin’s (BTC) crypto chart trends, the weekly timeframe tends to provide the clearest signals. However, for many altcoins, the daily timeframe tends to offer even better insights.
Note: Feel free to explore other timeframes. And in case you notice too many trend flips in a lower timeframe, it’s a sign to switch to a higher timeframe for more reliable signals.

Other Crypto Chart Analysis Tools
At this point, you know what the best free charting tool for crypto is. Plus, you are now properly acquainted with the best and most advanced charting tool for crypto. However, you may wish to explore other options and take an experimental approach to determine what your favorite crypto coin charting tool is.
As such, make sure to consider the following lists of crypto chart analysis tool platforms and indicators. After all, they all deserve a spot among your crypto analytics tools and crypto trading tools.
Popular crypto charting tool platforms:
- Altrady
- CryptoView
- Coinigy
- GoCharting
- Cryptowat.ch
- Koyfin
- Quadency
- Shrimpy
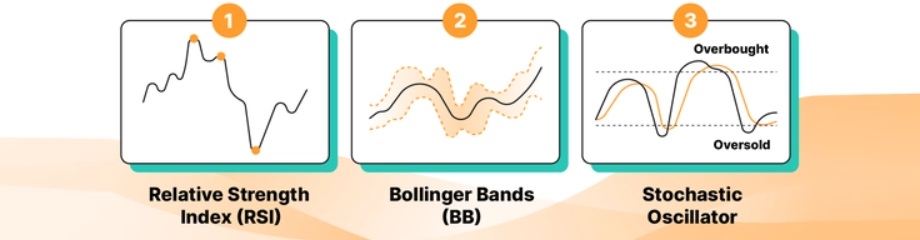
Analyze crypto chart trends with these indicators:
- Bollinger Bands (BB)
- Various MAs and EMAs (9 or 10, 20 or 21, and 200 EMAs are important)
- RSI
- Stochastic RSI
- Fibonacci retracement tool (Fib)
- MACD
- Fixed range volume profile (FRVP)
- ADX
- Money flow indexes (CMF and MFI)
- Open interest (OI)
- Heatmap
Note: Most of the above indicators come as a free crypto charting tool under the scope of TradingView’s free account. However, they are not nearly as powerful as Money Line, so make sure to never rely on any one of them alone. Instead, look for confluences among these indicators when using the best free charting tool for crypto (Moralis Money and Money Line).
Unlock Crypto Chart Trends with the Best Crypto Charting Tool – Key Takeaways
- Crypto chart analysis tools come in the form of platforms and indicators.
- TA has a proven track record of offering traders/investors an increased chance of winning in this game of probability.
- Every Moralis Money token page has the Price Chart section, which is a fair candidate for the “best free charting tools for crypto” title.
- Free TradingView plan is another great free crypto charting tool.
- Money Line is the best indicator for effortlessly making sense of crypto chart trends.
- The ultimate crypto chart analysis tool comes in the form of Money Line via TradingView.
- To access Money Line, one needs to opt for the Moralis Money Starter or Pro plan.
Both TradingView and Money Line are extremely powerful tools. However, unless you plan to focus only on Bitcoin and the leading altcoins, you’ll want to deploy tools that allow you to find the best altcoin opportunities. We are talking about those 50x, 100x, and even 100x coins.
And this is where Moralis Money has no parallel. It is the tool to use to spot which crypto will explode in 2024.
This tool’s main features provide you with invaluable crypto pump signals. So, if you were wondering how to find high volatility crypto, Moralis Money is the answer. In addition, Moralis Money also offers the best crypto whale tracker and crypto portfolio management features and much more.
However, the key to spotting the best altcoin opportunities is Moralis Money’s core feature – Token Explorer. As such, make sure to get going with this tool today! You can use the interactive widget below to run your first Token Explorer strategy.