The above animation offers a nice preview of the Moralis Money bubblemaps. And since this feature is extremely intuitive, most of you will instantly know how to make the most of it. As such, feel free to explore the crypto bubbles further by visiting the Moralis Money homepage right now.
However, in case you are hearing about the bubblemaps for the first time, you may want to start by covering the basics. If so, make sure to dive into the sections below. We’ll start by explaining what crypto bubbles are. Then, we’ll take a closer look at free bubblemaps offered by Moralis Money. This is where you’ll get to learn all you need to know about how to use this neat feature.
Last but not least, we’ll explore some other neat features that Moralis Money brings to the table. After all, they all help you utilize the power of on-chain insights. This enables you to better visualize the crypto market conditions and easily spot the best altcoin opportunities!

What Are Crypto Bubblemaps?
Crypto bubblemaps are graphic representations of different kinds of crypto market conditions, using circular shapes that resemble bubbles. This is why they are also referred to as crypto bubbles. However, the latter is not to be mistaken with the “crypto bubble” term, which is often used by the mainstream media when they aim to present the crypto market as being overinflated.
Moreover, bubblemaps are highly practical because they can deploy different colors and sizes to instantly create a clear overview. For instance, we all associate green with increase and red with decrease. We also immediately know that a larger bubble means more of something.
As such, this way of presenting specific market conditions deploys extremely simple methods. And it is this simplicity that makes crypto bubbles so powerful. After all, they tend to be one of the best ways for folks to quickly visualize specific aspects of crypto markets. When used to depict price changes of cryptocurrencies, it is a great way of offering a clear overview of the current market conditions.
Free Crypto Bubblemaps
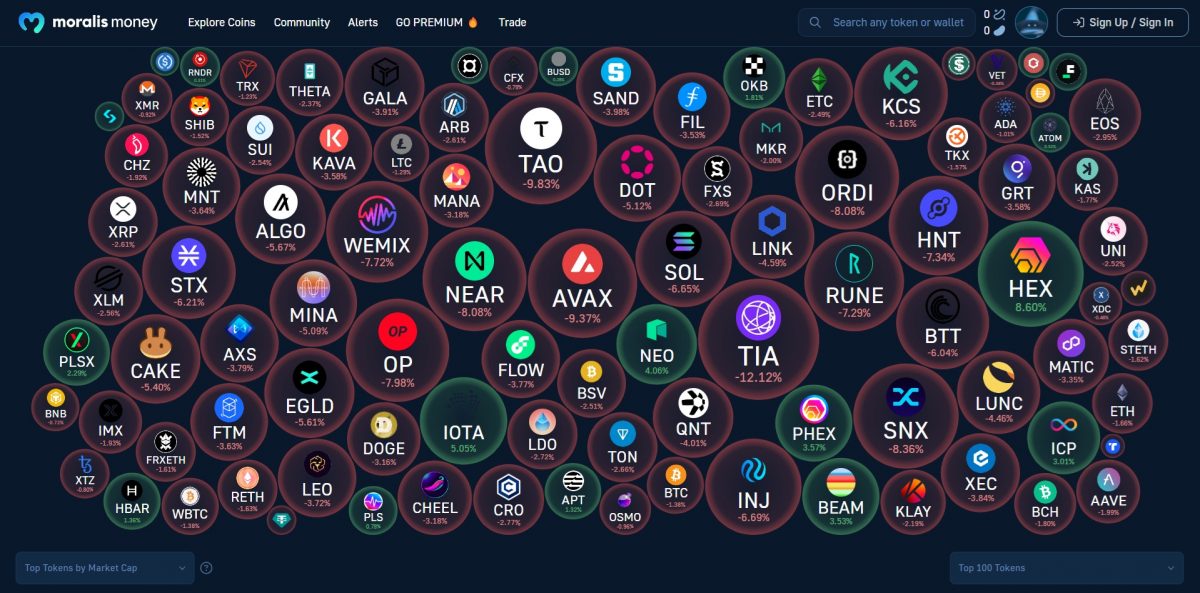
These days, there are several platforms that deploy the power of bubblemaps. However, the best free overview of the crypto markets awaits you on the Moralis Money homepage. This best crypto trading tool allows you to visualize crypto bubbles based on top tokens by market cap (MC) with 24-hour percentage price change.
So, the red bubbles represent tokens that have decreased in price in the last 24 hours. On the other hand, the green ones indicate cryptocurrencies that have increased in value. Moreover, the larger the bubble, the greater the price change for that token. Of course, you can see the exact 24-hour price change inside each bubble, just below the token’s logo and ticker.
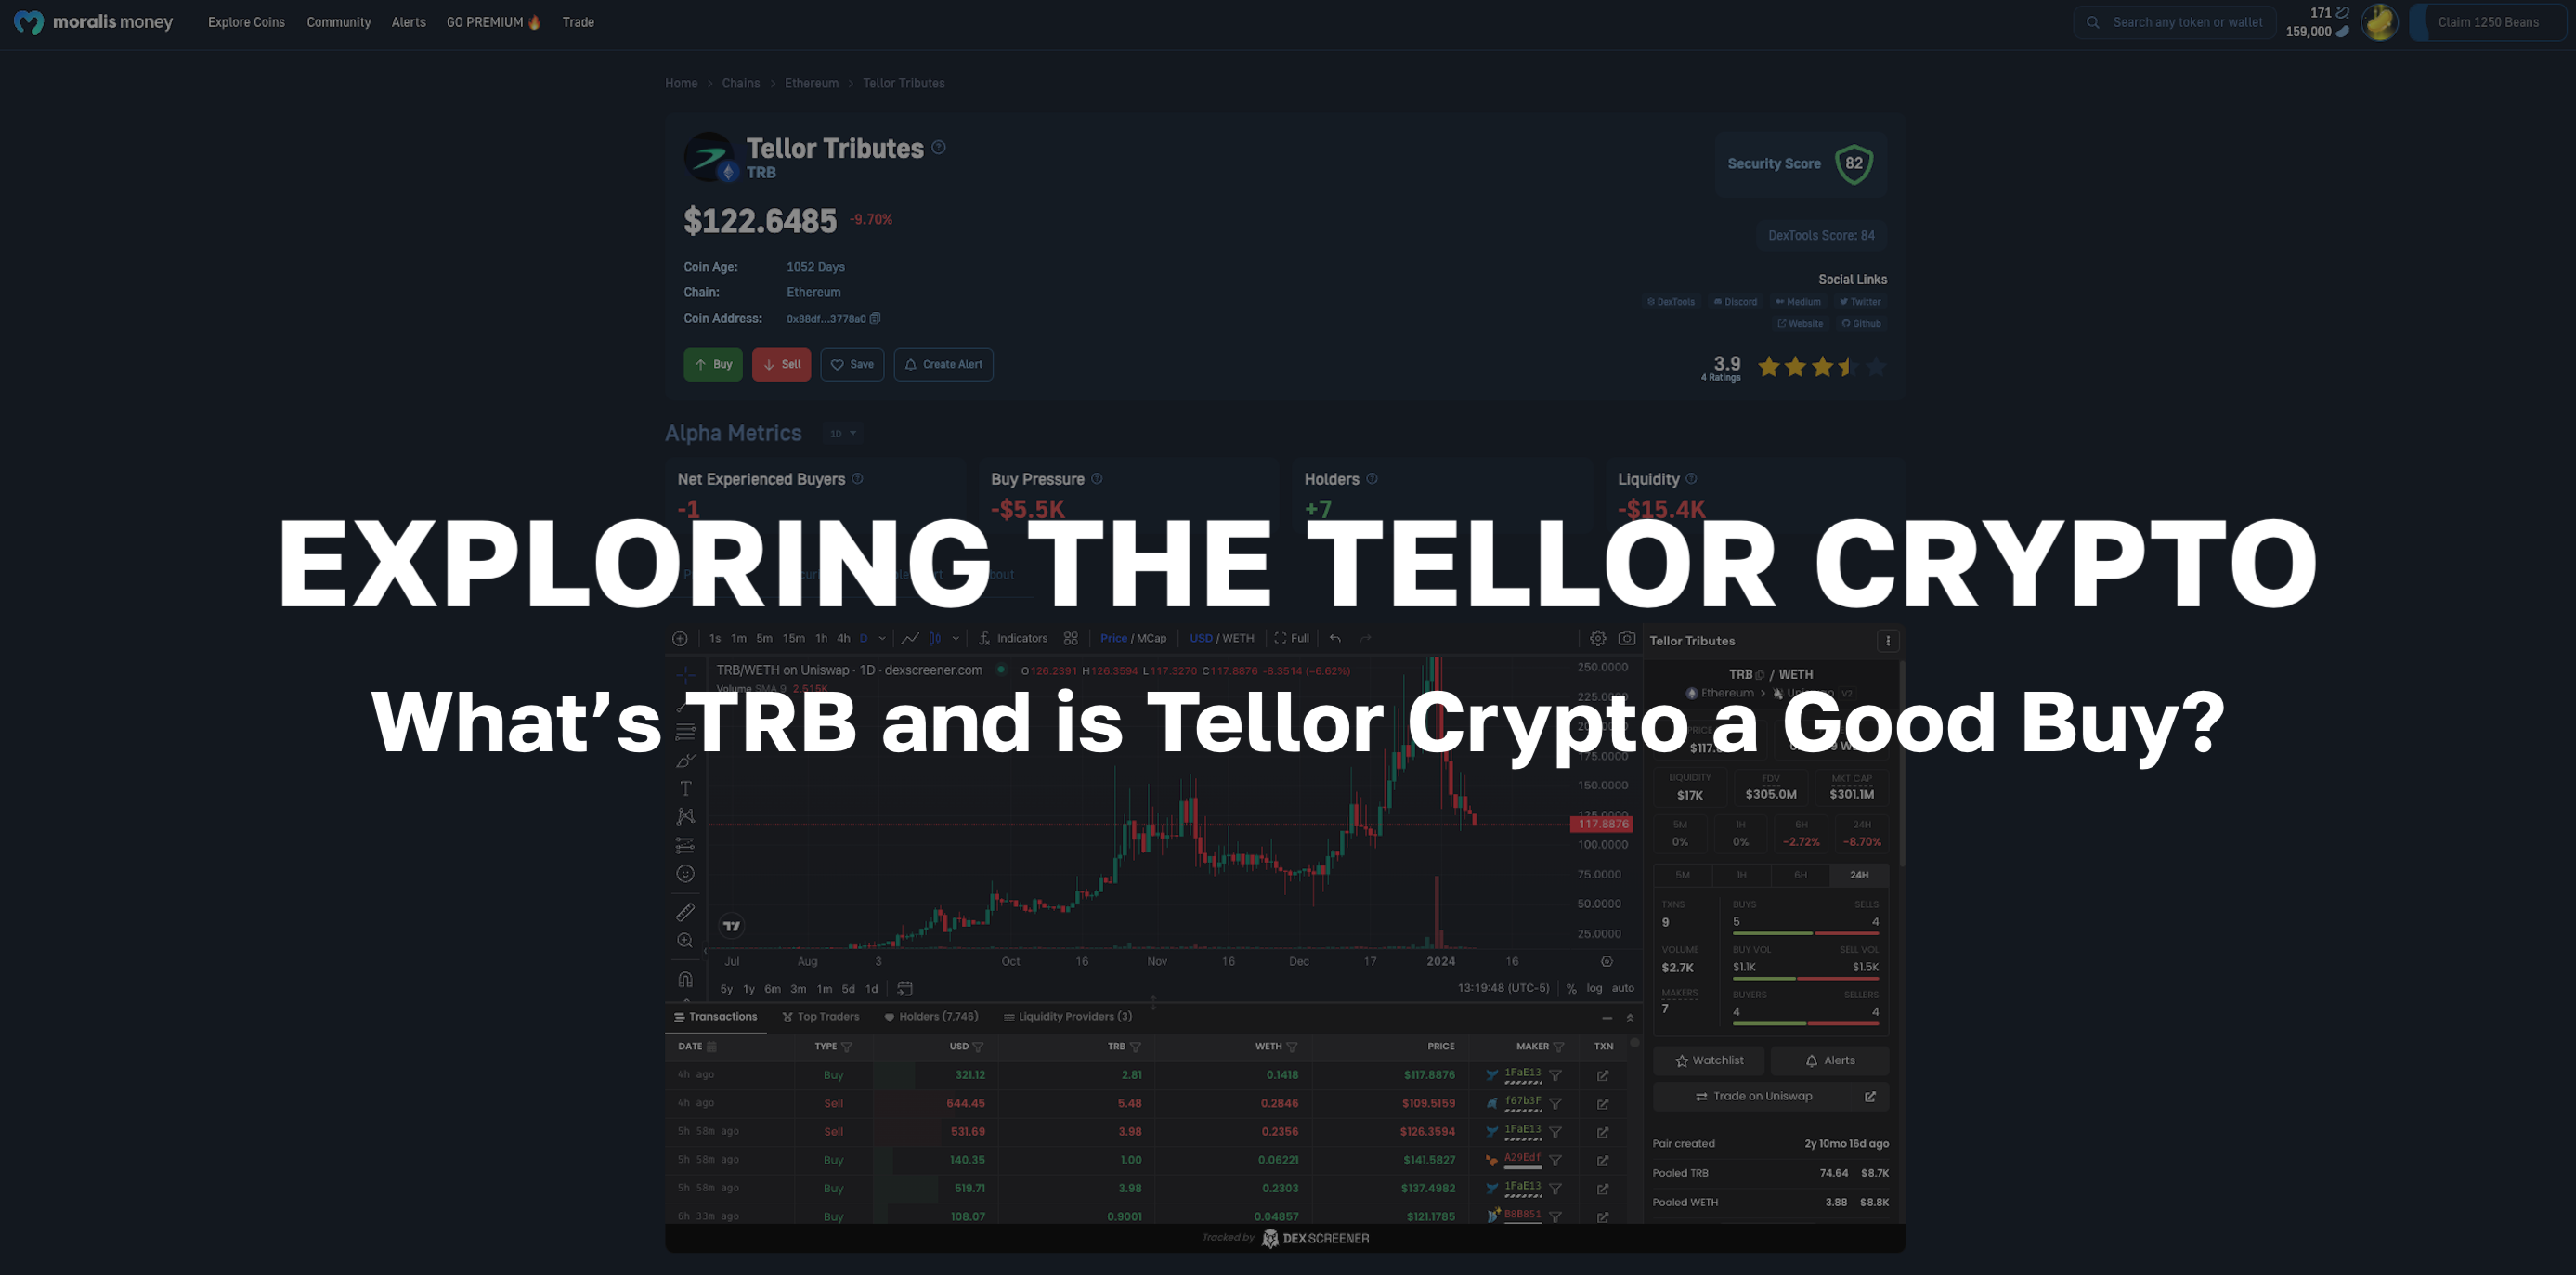
Aside from the market overview bubblemaps on the Moralis Money homepage, the platform also offers this type of visualization for token distributions. That kind of overview awaits you on individual Moralis Money token pages.
These pages are designed to DYOR individual altcoins and the project’s behind them. They provide you with all the resources and tools to determine if the asset in question is a worthy investment/trade. Plus, by combining the insights of live prices and real-time on-chain metrics, these pages allow you to determine if now is a good time to buy.
And, here’s an example of the Bubble Chart section:
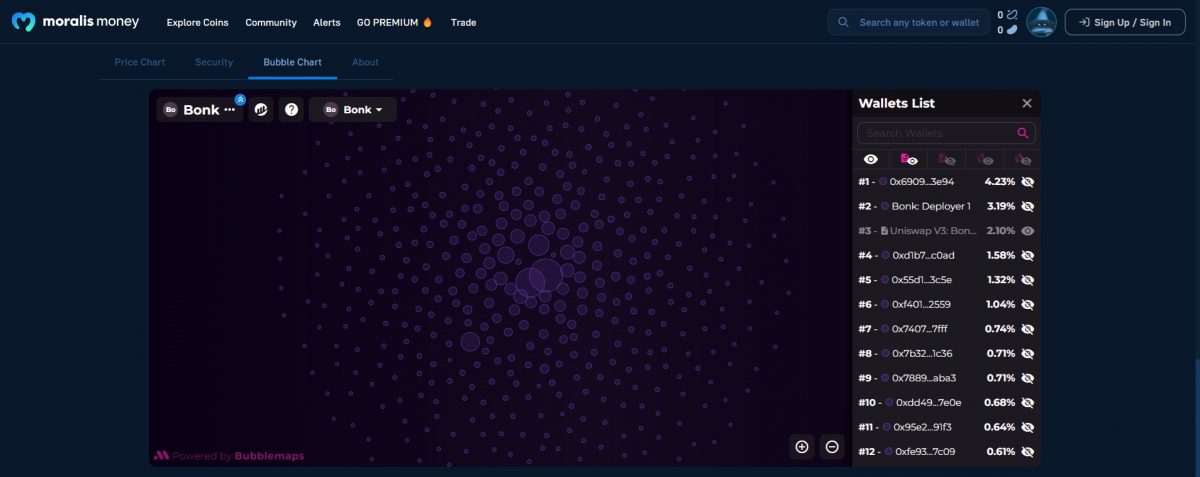
In the case of token distribution, the bubble size represents the token bag size. So, the larger the bubble, the more instances of the token in question the address/wallet holds.
How to Access Moralis Money’s Crypto Bubbles
The past to the market overview bubblemaps is as straightforward as it gets. After all, you just need to visit the Moralis Money homepage to explore that neat overview of the crypto markets.
On the other hand, there are multiple ways to access the Moralis Money token pages (this is where you can find the Bubble Chart sections):
- Via Moralis Money dynamic lists:
- By using the Moralis Money search bar:
- By clicking a specific bubble (for EVM-compatible tokens):
Now that you know how to access the free Moralis Money bubblemaps, let’s explore how to make the most of them.
How to Use Moralis Money’s Crypto Bubblemaps
By this point, you already know how easy it is to use Moralis Money’s bubblemaps. You now know that the crypto bubbles on the platform’s homepage enable you to get an understanding of the crypto market. This is where you can explore the tokens’ moves over the past 24 hours. And you get to do that for the top 500 tokens by market cap in bundles of 100 tokens.
Since the crypto market moves quickly, using such a simple yet powerful visualization tool can be one of the best ways to gauge winners and losers in the market on a daily basis.
Homepage Crypto Bubbles
So, how to use the Moralis Money homepage bubblemaps? Start by accessing that page. By default, you will see the bundle of the top 100 tokens by market cap. However, using the button in the bottom-right corner, you can easily switch to any other bundle of 100 tokens among the top 500 cryptocurrencies by MC:
As you can see in the above animation, the Moralis Money crypto bubbles react to the hovering of the mouse. So, by placing your mouse cursor on top of any green bubble, all red bubbles will disappear. This will enable you to fully focus on the winners. Of course, the bubblemap works in the same manner for the daily losers as well.
Moreover, you also already know, that you can simply click on any of the tokens to explore that asset further. If the token in question is EVM-compatible, then you will land on that asset’s Moralis Money token page. However, if the token is not EVM-compatible, then you will be redirected to CoinGecko’s page for that particular coin.
Nonetheless, you might have noticed that there’s another button in the bottom-left corner. As you can see above, by default, it is set to “Top Tokens by Market Cap”. And as a free Moralis Money user, this is the only option you’ll be able to select.
So, if you wish to switch to the “Top Tokens On The Move” bubblemap, you’ll need to upgrade to the Starter or Pro plan. That feature displays crypto bubbles for all the tokens that are gaining on-chain momentum regardless of their market cap.
Last but not least, the crypto bubbles on Moralis Money’s homepage are interactive, so you can easily move them around and arrange them as you please.
Moralis Money Token Pages Bubbles
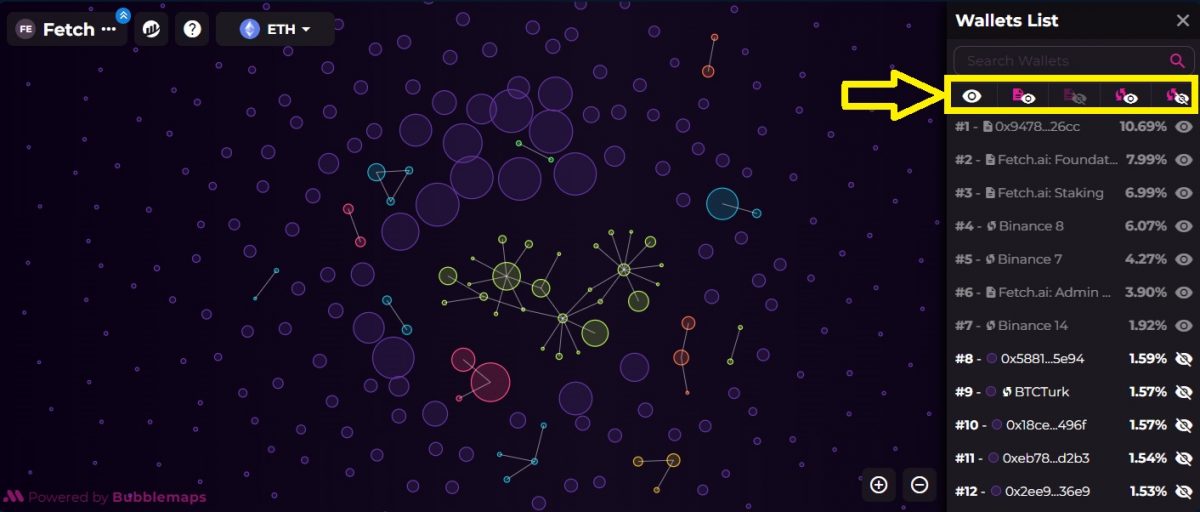
While the Moralis Money homepage crypto bubbles focus on price action and on-chain momentum, the Bubble Chart sections present tokens’ distributions. This way, you can immediately see if there’s any Web3 address holding a particularly large percentage of the cryptocurrency.
Moreover, the bubblemaps on Moralis Money’s token pages are also interactive. Thus, you get to move the bubbles around just like the ones on the homepage. Furthermore, by clicking on the bubbles, you get to see that address’ holding size. Plus, by using the navigation menu on the right-hand side, you can select what types of addresses you wish to display:
The power of the distribution bubblemaps lies in the fact that they allow you to avoid investing in tokens where large holders (a.k.a. “whales”) control the majority of tokens.
On-Chain Crypto Market Visualization
Both of the above-presented types of Moralis Money crypto bubbles can be very useful. And the fact that you can access them for free is definitely a mention-worthy upside. However, there are several even more powerful features that Moralis Money has to offer. For instance, the platform also offers the best crypto pump detector, crypto whale tracker, crypto scanner, and more.
If you remember from above, we mentioned that one of the popular ways to access Moralis Money token pages is via dynamic lists of altcoin opportunities. So, now it’s time you find out how to generate those lists.
Well, this is where Moralis Money’s main feature – Token Explorer – enters the scene. This powerful tool enables you to deploy predetermined and unique strategies. The former ones are particularly useful for beginners as they eliminate any guesswork:
However, to gain further advantage, you’ll want to get comfortable with unique Token Explorer strategies:
Just like Moralis Money’s bubblemaps, Token Explorer is available to everyone online for free. However, the ultimate edge, which lies in accessing all the lower timeframes, awaits the Starter and Pro users. Of course, there are several additional benefits that come with the paid plans, including access to the Money Line indicator. You can see the power of Money Line in the section below.
All-in-all, Moralis Money offers the best user experience among all the blockchain analytics tools. It combines the power of real-time on-chain metrics and simplicity, unlike other popular crypto analysis tools. By using on-chain data, it empowers traders on when to take action. This, in combination with the power of Money Line, gives Moralis Money the advantage over other crypto trading tools.
The Power of Money Line
Above, you learned that those who upgrade to a Pro account get access to the Money Line indicator. We also already mentioned that this indicator is an extremely powerful crypto trading tool. Just like Moralis Money, it combines the power of on-chain insights with simplicity.
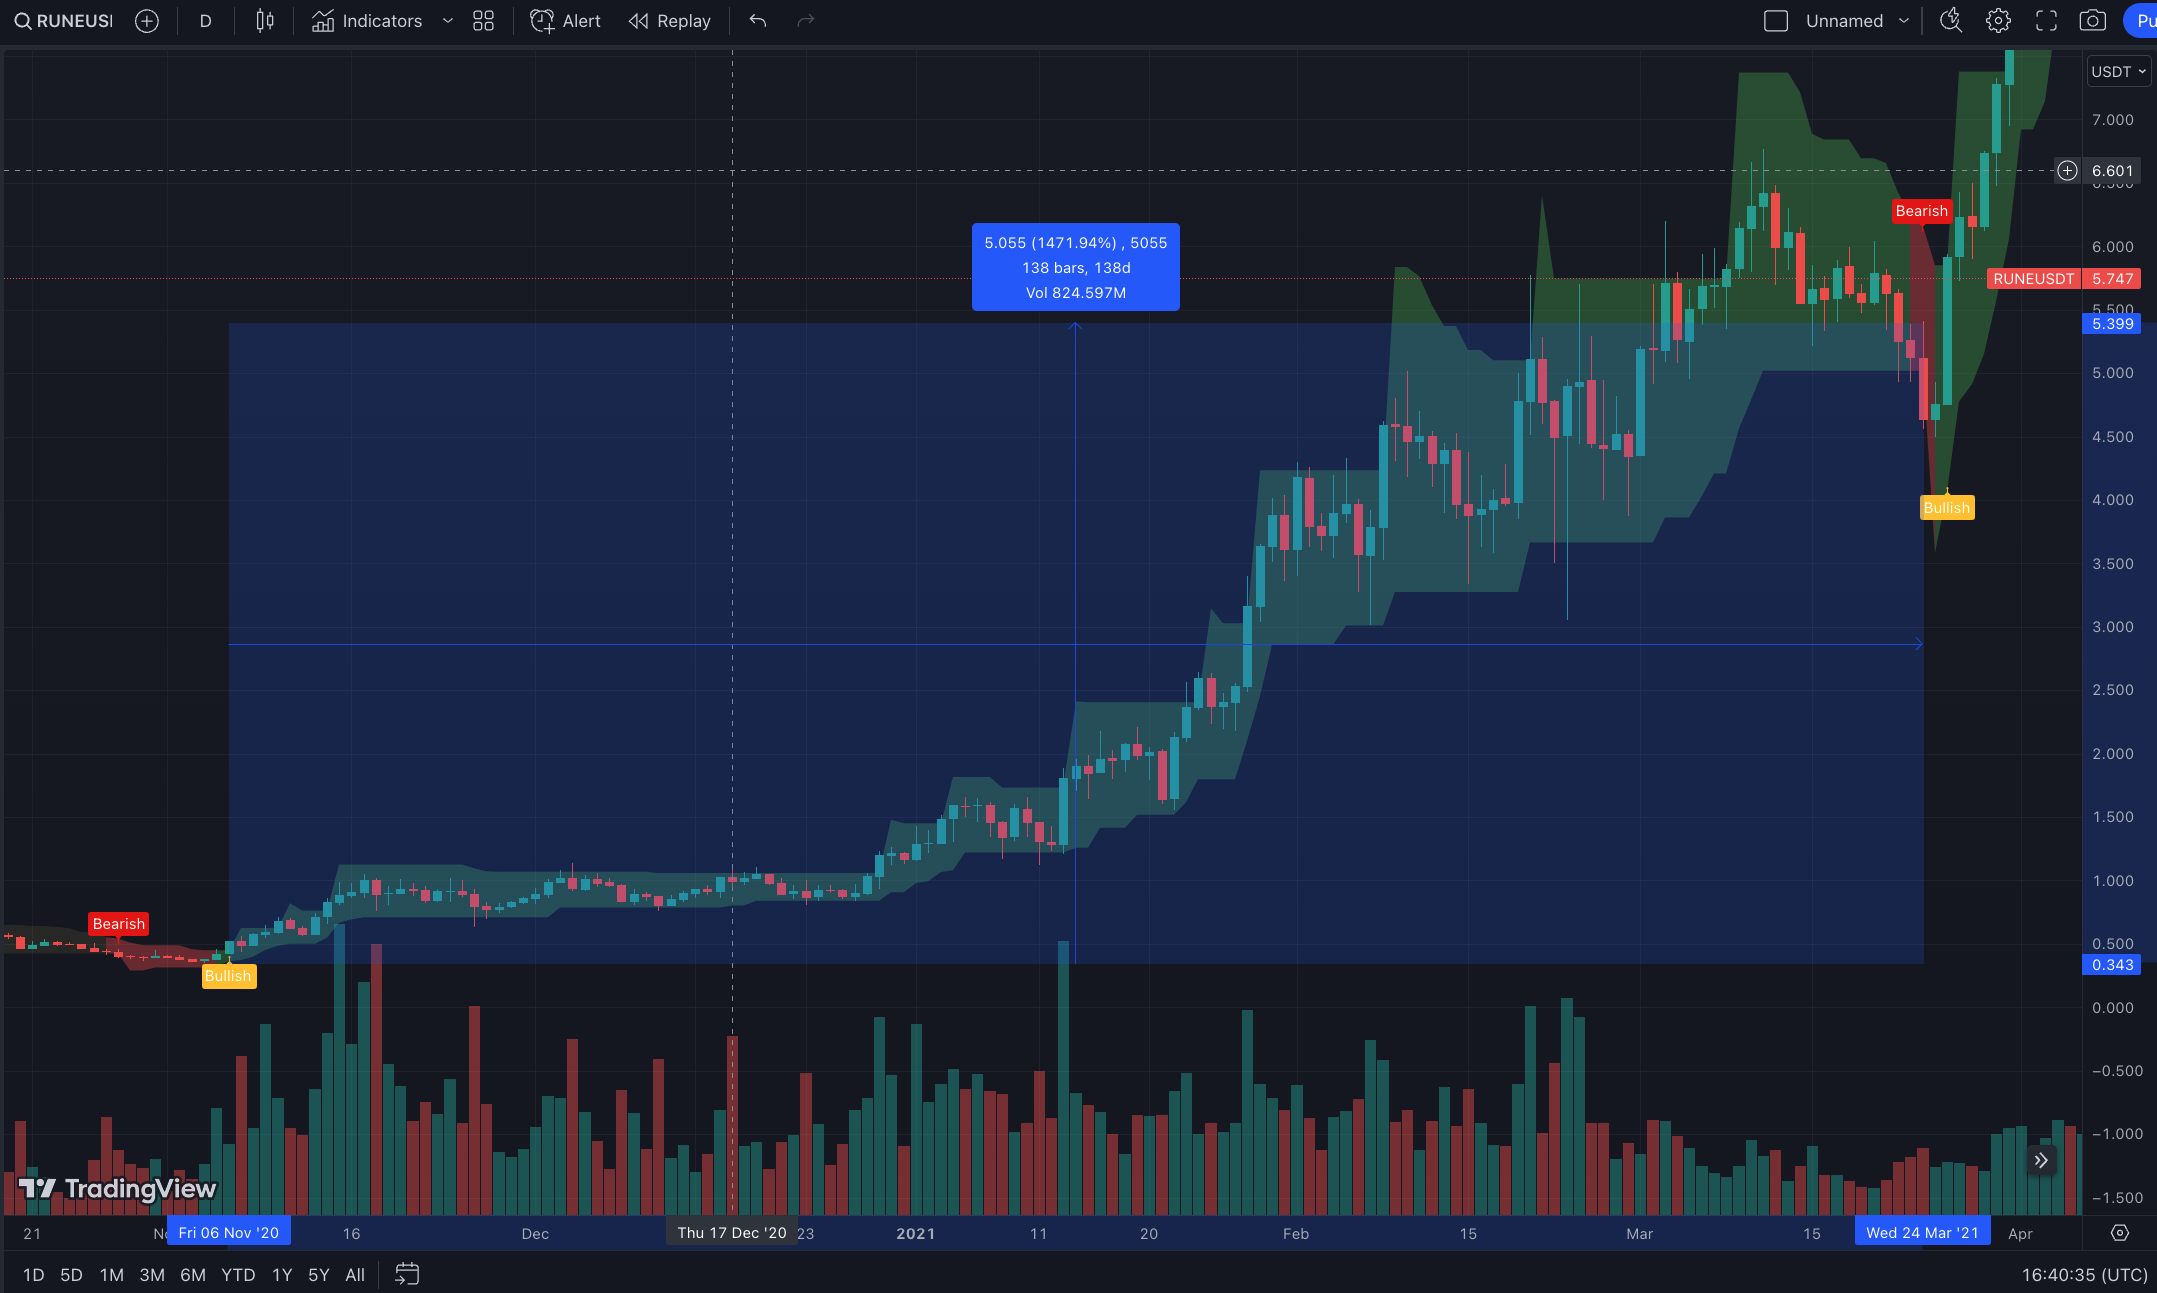
So, by simply printing “bearish” or “bullish”, it indicates great times to sell/short or buy/long the asset in question.
For example, if someone invested $1,000 into RUNE when the Money Line indicator turned “Bullish” on November 6, 2020, and sold when it printed “Bearish” on March 24, 2021, that person would have made a 1,471% return on your investment, a massive $13,710 gain:
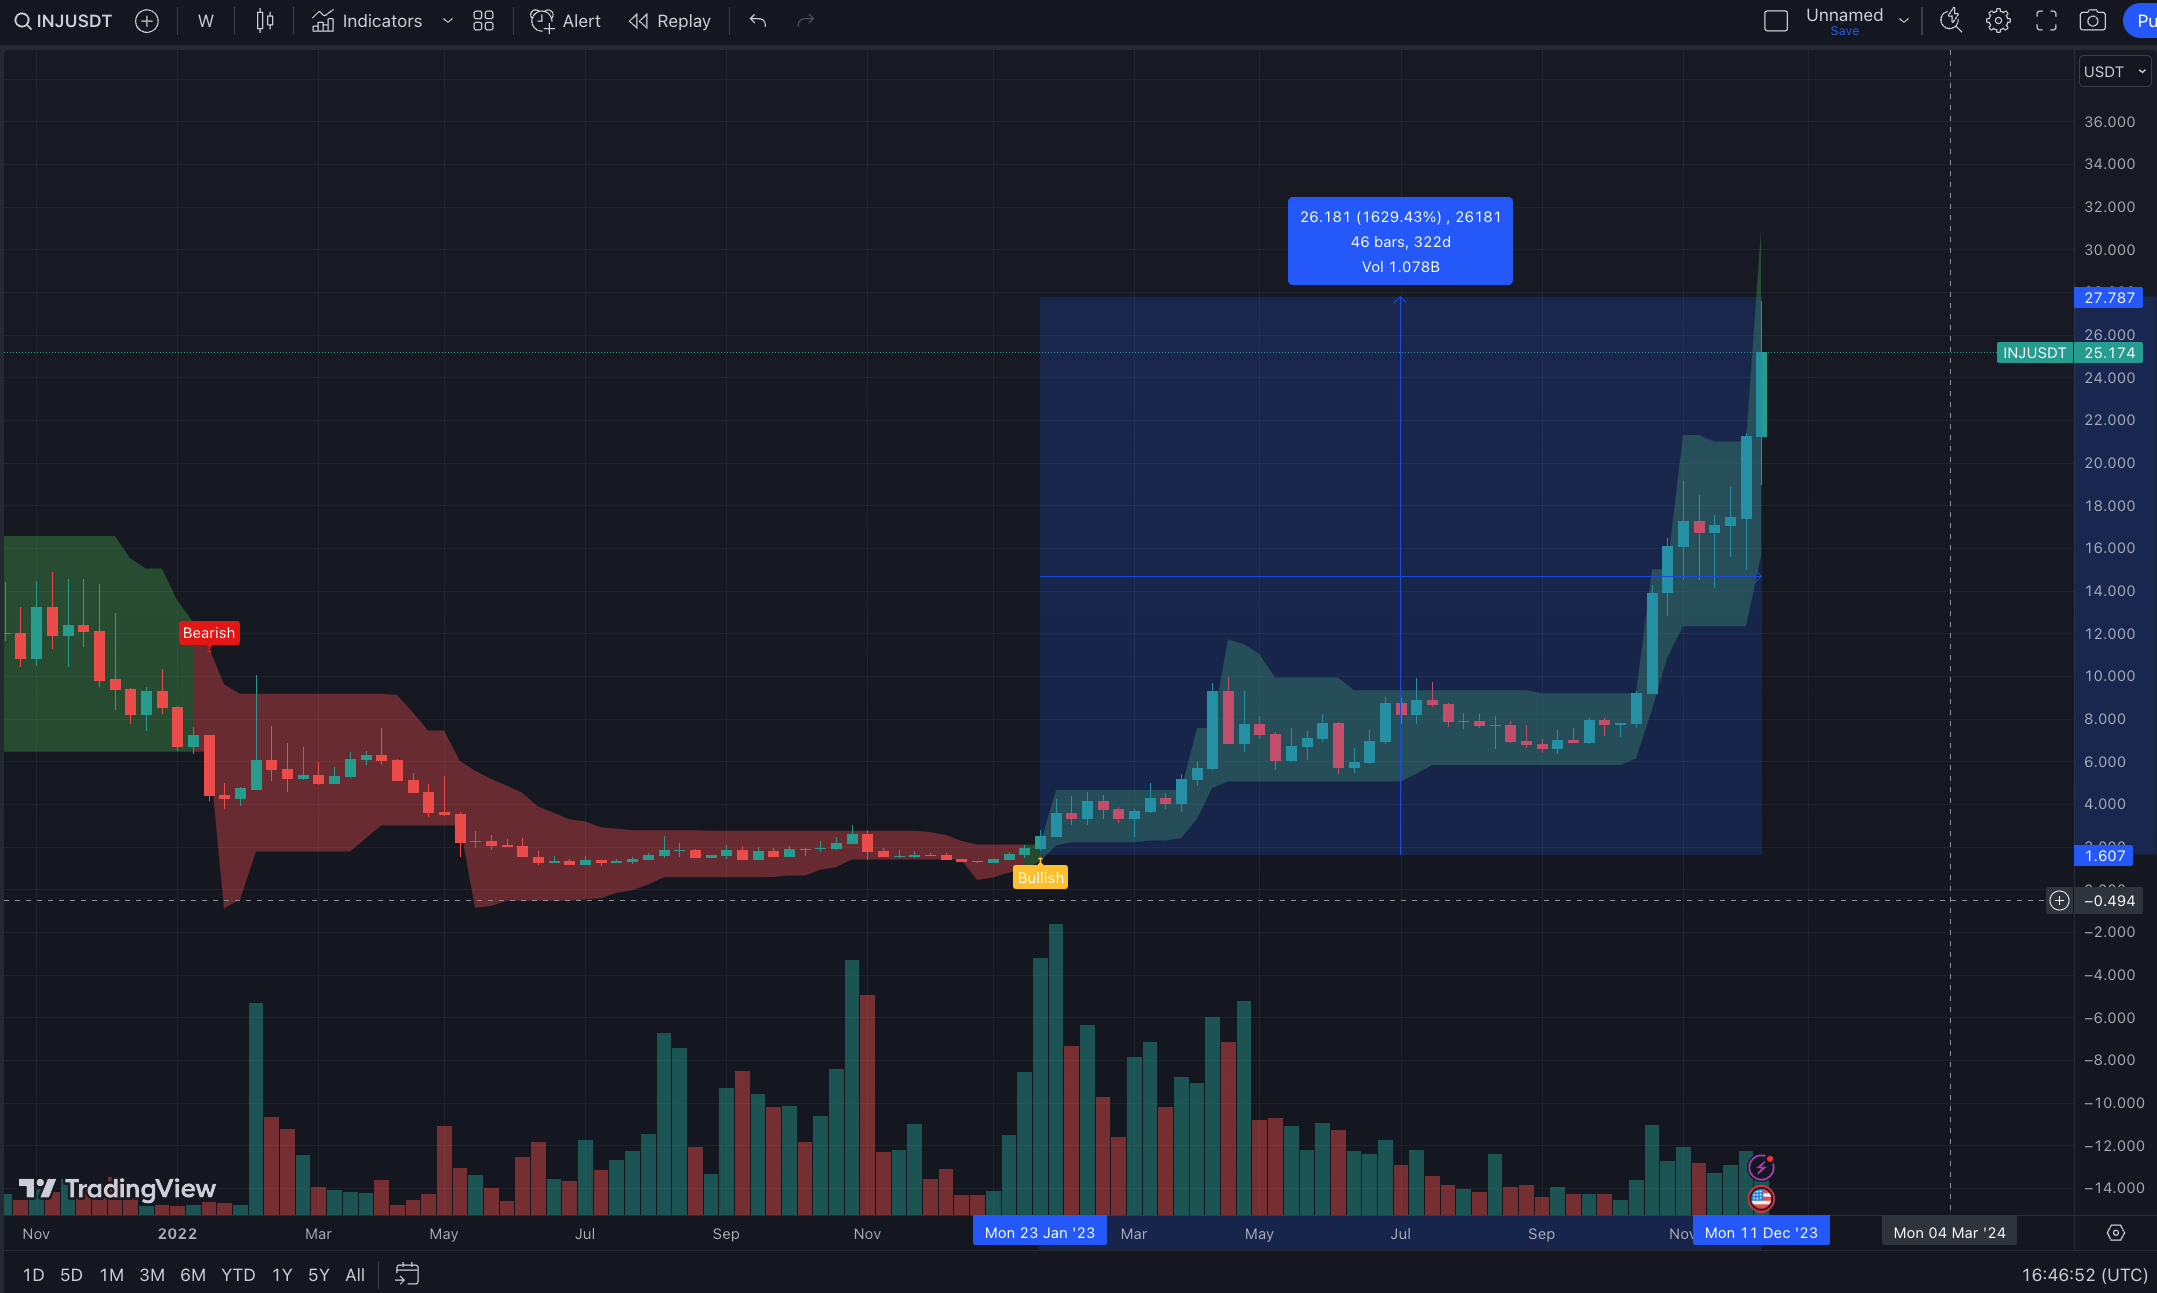
A more recent example would be INJ. On January 23rd, 2023, Money Line printed “Bullish”. If someone bought $1,000 worth of INJ at that point and sold at the recent top, they would be sitting on a 1,629% or $15,290 gain:
This trading tool is meant for those who are looking to trade and make massive gains. It is a powerful augmentation of Moralis Money’s free market visualization tools as well as the platform’s Starter and Pro features. However, Moralis Money’s bubblemaps are a perfect free way to start understanding how the crypto market moves.
Crypto Bubblemaps – Vizualize Market Trends & Make Gains with Free Crypto Bubbles – Key Takeaways
- Bubblemaps are intuitive visual representations of various crypto market conditions. These tools use circles that look like bubbles, which is why they are also known as crypto bubbles.
- Moralis Money offers the best bubblemaps for an overview of the altcoin market, for spotting main daily winners and losers, and for exploring tokens’ distributions.
- The above-listed bubblemaps are free; however, by upgrading to the Moralis Money Starter or Pro plan, you also access a bubblemap that shows tokens that are on the move.
- Crypto bubbles are just one of many Moralis Money features, which combined make it the best tool for finding altcoin opportunities.
- To start generating dynamic lists of altcoins with potential, get comfortable with Token Explorer.
- If you decide to lock in the Starter or Pro plan, you also get to deploy the power of Money Line. This indicator has a proven track record and those who have been following its signals were able to make 1,000%-plus gains on many occasions.
With these key takeaways in mind, make sure to visit Moralis Money’s homepage. This is where you can experience the power of crypto bubbles first-hand for free. Also, make sure to explore all other platform’s features. You can access them via the top menu.
Moreover, as mentioned above, some of the features are limited to the Starter and Pro users. So, consider upgrading to avoid missing out on the best altcoin opportunities. And in case you are not ready to commit, you can also take on the platform’s 7-day trial for less than what you’d spend on a week’s worth of coffee.